- Home
- Digital Services
- Dashboards and BI
Dashboards and BI
What We Offer
Latest News
Events
Transform environmental data into decisions with our interactive dashboards
We design visual intelligence solutions that integrate, organize, and simplify the interpretation of complex data on water quality, water balance, environmental monitoring, and more. Our dashboards feature detailed analyses, dynamic maps, time series, and compliance indicators—empowering companies, consultancies, and regulatory agencies to make fast, data-driven, and sustainable decisions.
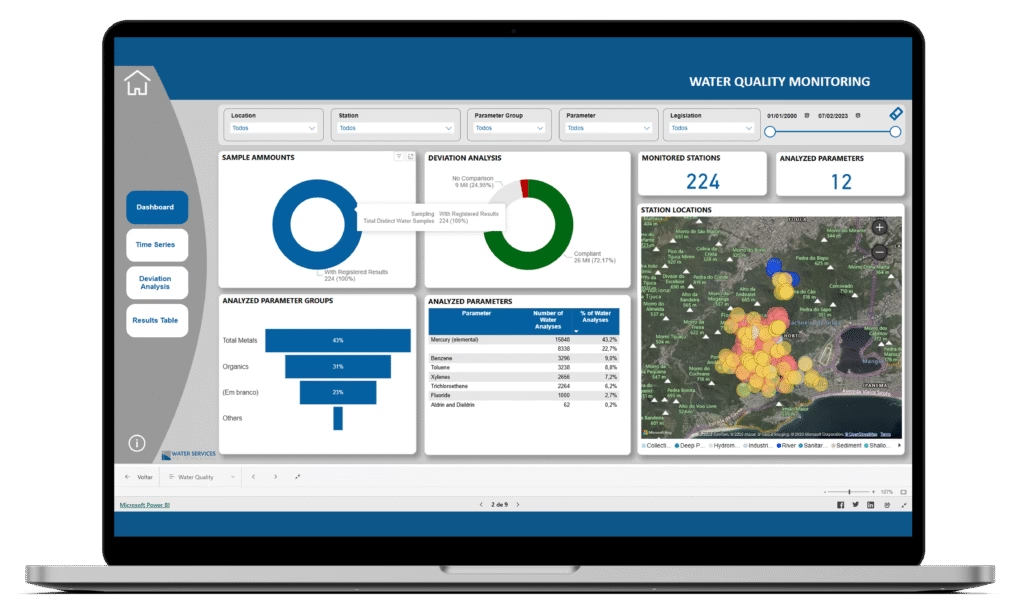
Water Quality Monitoring
Interactive dashboards that transform complex water quality data into clear visual insights—supporting smarter, faster decisions for mining operations and environmental compliance.
Key challenges this dashboard helps solve:
- Quickly identify parameters exceeding regulatory thresholds.
- Spot low sampling density areas through georeferenced maps.
- Uncover seasonal variations and long-term patterns with dynamic graphs.
- Integrate field and lab results into a single, user-friendly platform.
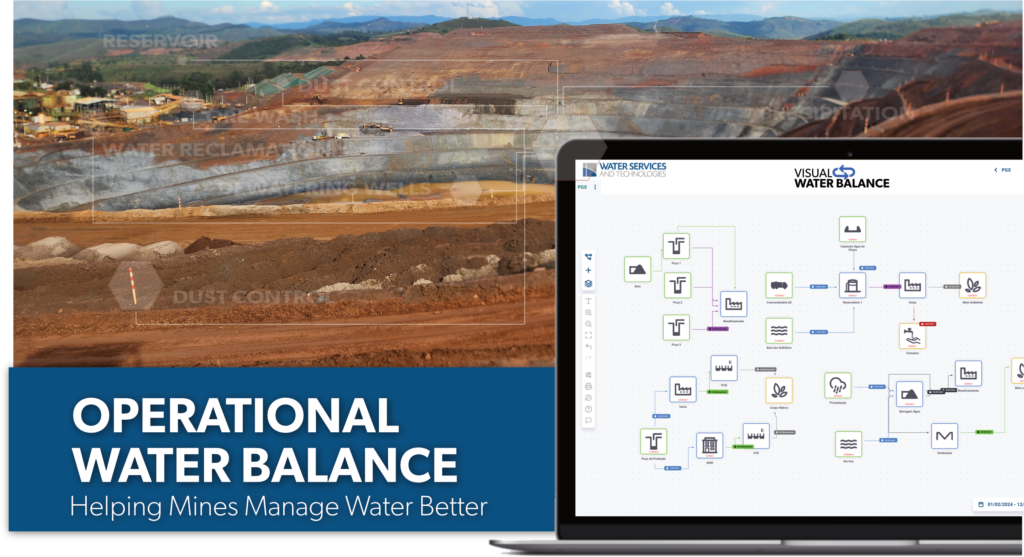
Water Balance
A real-time, interactive tool that centralizes water use, reuse, and compliance metrics—helping industries manage resources sustainably and meet operational and environmental goals.
Key challenges this dashboard helps solve:
- Track inputs, outputs, and reuse volumes with intuitive visuals.
- Monitor license validity and stay aligned with regulations.
- Compare KPIs against regulatory and internal efficiency targets.
- Analyze monthly demand by water source and operational purpose.

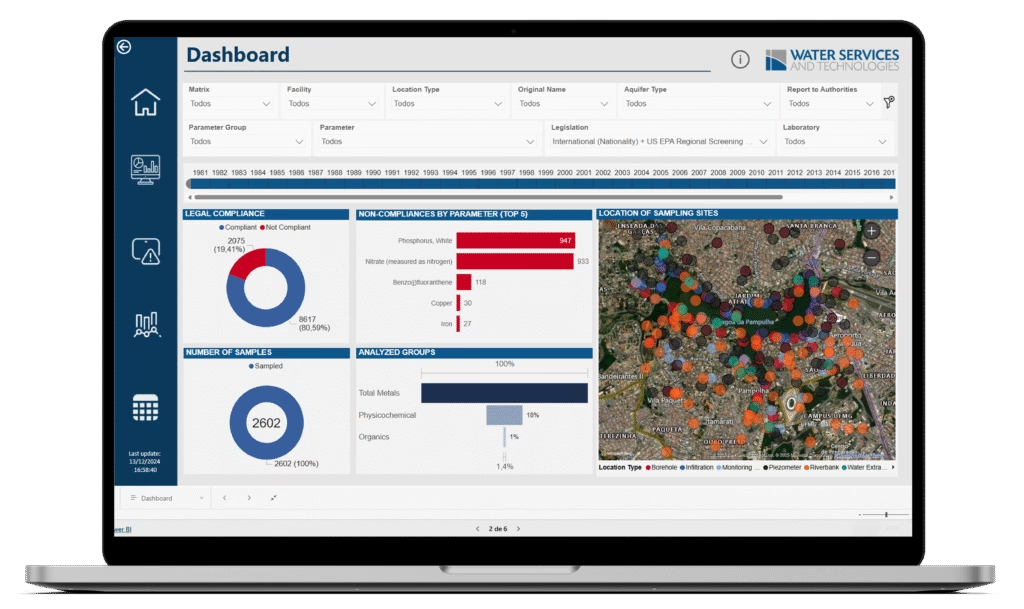
Integrated Environmental Monitoring
A centralized, real-time platform that brings together key environmental indicators—supporting efficient analysis, regulatory compliance, and informed environmental management.
Key challenges this dashboard helps solve:
- Consolidates environmental data streams into a unified interface.
- Connects climate, air, water, and soil information for holistic analysis.
- Enables quick identification of anomalies and compliance deviations.
- Supports legal reviews with reference thresholds and historical context.
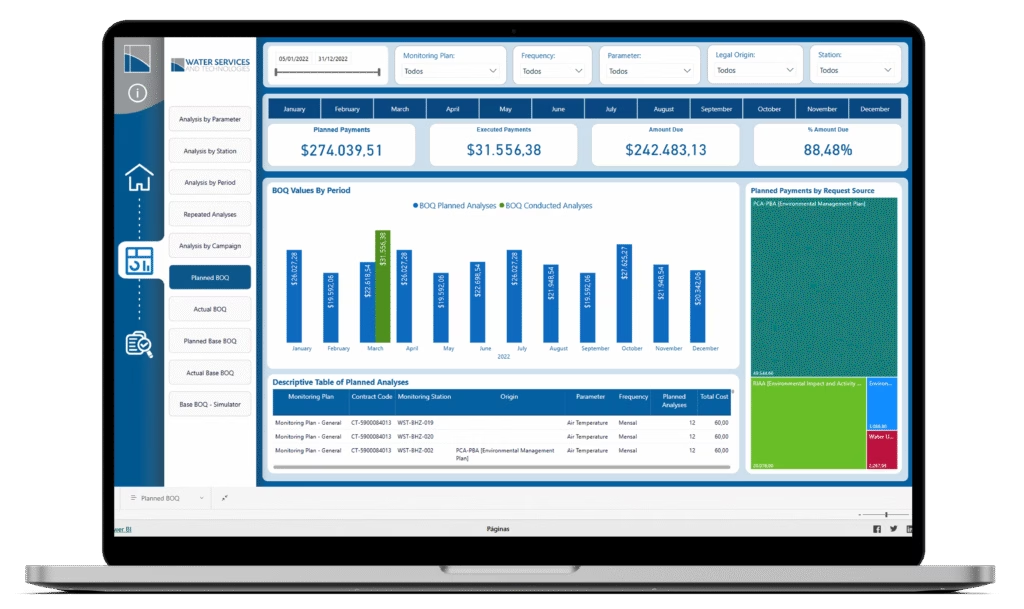
Monitoring Plan Management
A visual and structured solution for tracking the execution of physico-chemical monitoring plans, comparing planned and completed analyses to support performance, compliance, and continuous improvement.
Key challenges this dashboard helps solve:
- Highlights mismatches between planned and executed analyses and campaigns.
- Provides clear tracking of campaign status by period, parameter, and location.
- Detects oversampling and execution gaps for smarter resource allocation.
- Supports adaptive updates to plans based on legal, operational, or environmental shifts.
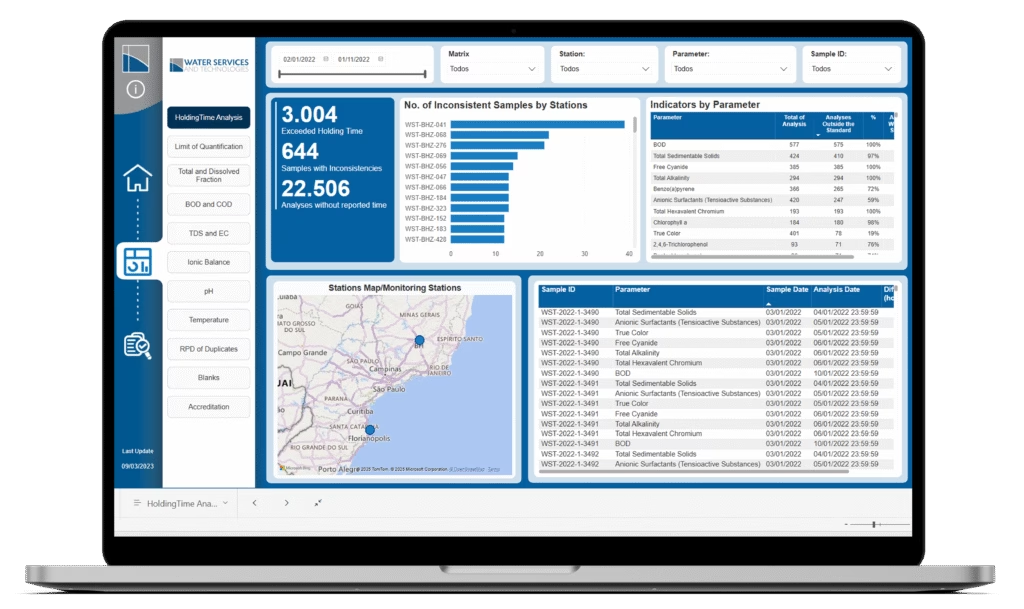
QAQC Report Dashboard
A specialized dashboard that verifies the integrity of environmental sampling data through automated quality checks—ensuring that decision-making is based on accurate, traceable, and compliant information.
Key challenges this dashboard helps solve:
- Visualizes sample holding times, blanks, and lab accreditations to validate reliability.
- Flags inconsistencies in BOD/COD, TDS/EC, pH/temperature, and quantification limits.
- Summarizes anomalies across campaigns to prioritize corrective actions.
- Centralizes and automates checks across parameters, labs, and sampling events.
Try it out!